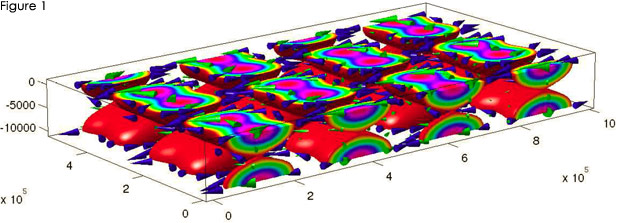
These figures show the results of numerical simulations performed at the Institute for Scientific Computing and Applied Mathematics at Indiana University. They are related to three-dimensional simulations of a flow in a limited domain, corresponding to simplified models of geophysical flows concerning weather forecast (short term forecast) or climate forecast (long term forecast). The issues are numerous and very diverse, including some ideas of the underlying physics, the mathematical choice of the boundary conditions at the boundary, the development of efficient and stable numerical methods, and the practical representation of the results using advanced graphic techniques.
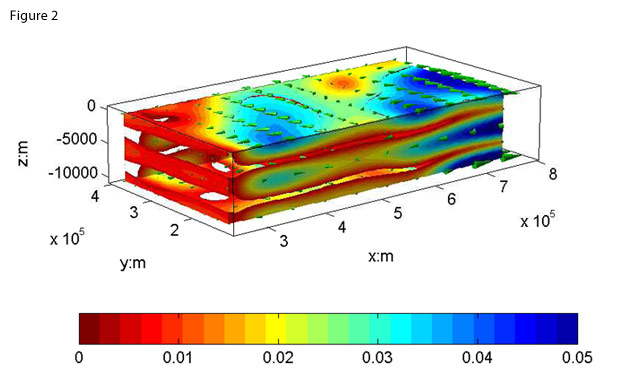
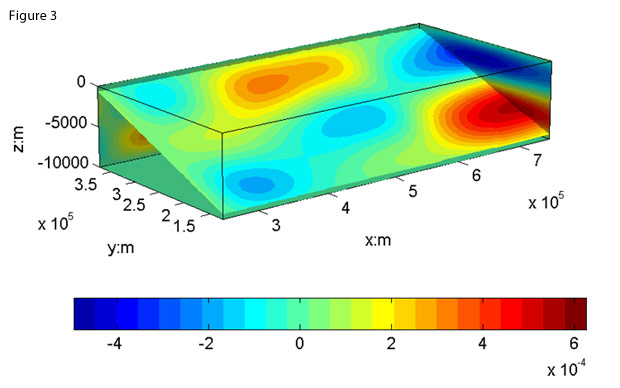
The three figures represent color coded values of one of the important parameters; the color code appears underneath in Figures 2 and 3. Figure 1 correspond to the initial values of the velocity vector of the fluid (air or water). The directions of the velocities correspond to the axes of the small cones shown, and the length of the cone is proportional to the magnitude of the velocity vector. Figure 2 corresponds to the final value (at the end of the numerical simulation) of the velocity vector. Figure 3 corresponds to the final value of the temperature.- Roger Temam
 The College of Arts