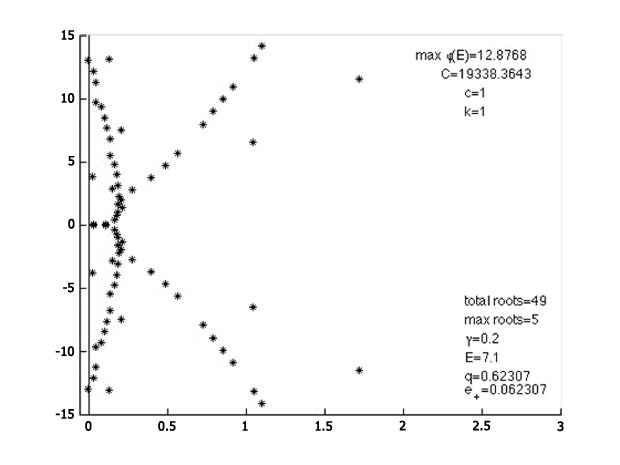
The image below depicts the spectra, or resonant frequencies, of an unstable detonation wave, plotted in the complex plane, where the vertical line to the left is the imaginary axis. Each point λ marked in the figure corresponds to a time-exponential solution eλtw(x) of the linearized perturbation equations about a steadily propagating detonation front, growing or decaying as eReal(λ)t. Thus, points appearing to the right of the vertical imaginary axis are exponentially growing, corresponding to instability.
Spectral analysis of solutions of partial differential equations is a standard way of assessing their stability under perturbation, typically carried out numerically. However, such computations can be numerically quite challenging. The computations carried out here recreate famous numerical experiments of Lee and Stewart in 1990 on the high activation limit, for which detonations are known to be more and more unstable: here, we see 49 unstable modes, forming an interesting "diffraction pattern." The computation of Lee and Stewart required several hours on a $15-20 million Cray X-MP/48 supercomputer; ours was carried out on a Mac 8-core desktop in a similar amount of time. The difference: several orders of magnitude more computing power per dollar, and an algorithm 2-3 orders of magnitude faster than the one originally used by Lee and Stewart, developed together by Blake Barker, Jeff Humpherys, and Kevin Zumbrun.
This is part of a larger research effort at IU combining numerics and rigorous analysis to understand the stability and bifurcation of detonation waves; see below for some recent papers. - Kevin Zumbrun

 The College of Arts